With more than 70% of home-buyers looking on the Web for real estate to buy, we wondered if it made sense when pricing a house to take into account the parameters used on most real estate search sites. For example, since every site lets folks filter on price in increments of $25,000 at lower price ranges and increments of $50,000 at higher price ranges, wouldn’t a property priced at $549,999 get seen by more Web shoppers than one priced at $550,001?

The answer is maybe, just a little.
How so? Enter Mose Andre, Redfin’s ace statistician, who analyzed the logs of the Redfin site to determine how often Seattle users of our site see properties in different price ranges, between September 10, 2007 and September 24, 2007. His findings:
- About 30% of searches don’t even filter on price. But the number of searches that don’t filter on price is exaggerated on Redfin’s site because Redfin.com price filters aren’t easy for users to find.
- For most neighborhoods, the maximum percentage of Redfin searches you are likely to lose by moving from one price band to the next is 6.5% . For most Seattle neighborhoods, this band occurs for homes costing more than $550,000.
Based on these findings, we would only recommend taking into account how search sites filter on price in cases where a property is priced very near one of the popular threshold amounts. In other words, if you were going to price a house at $570,000, you shouldn’t price at $549,000 just to have it show up in 6.5% more price-filtered searches; but we would consider it if you you were going to price a house at $551,000.
You can see how this plays out on Mose’s graph of search exposure and listing count for Bridle Trails:
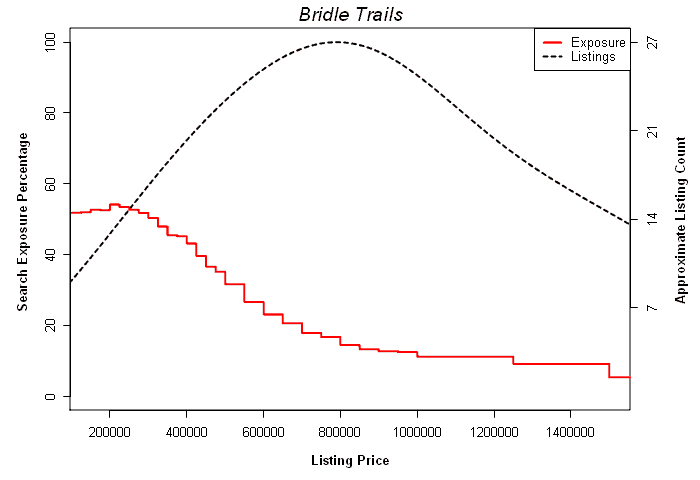
The red line represents the percentage of Redfin’s Bridle Trails searches filtering on price that include Bridle Trails properties at different price points; use the numbers on the left axis to measure the percentage of searches that return a result at the prices appearing along the bottom axis. As you can see, less than 20% of Redfin’s Bridle Trails searches filtering on price include properties costing more than $800,000.
The black line represents the density of listings in the area; more precisely it is a curve fitted to the shape of a histogram representing the number of listings at different prices. You can use the numbers at right to track the number of listings at different price ranges. The most common price is the one where demand becomes scarce: $800,000.
The biggest drop in buyer exposure in Bridle Trails occurs at $550,000. One reason drops tend to occur at this point is that Redfin, like many other real estate search sites, only allows price filtering at $50,000 increments for prices greater than $500,000. So the first $50,000 steps are doozies.
Let’s look at a few more graphs, this one of Capitol Hill:
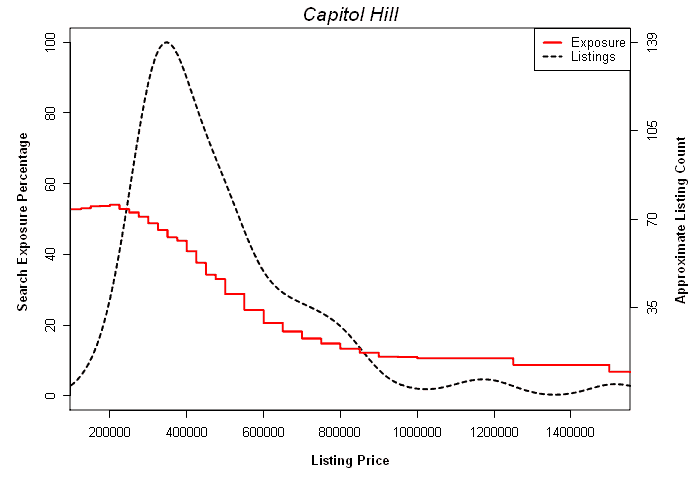
Here most of the inventory is clustered at a price just below $400,000, probably because there is a glut of condominiums on the market, and most of the price-filtered searches are in that range. There is a little hump around $700,000 for houses and townhouses in the neighborhood.
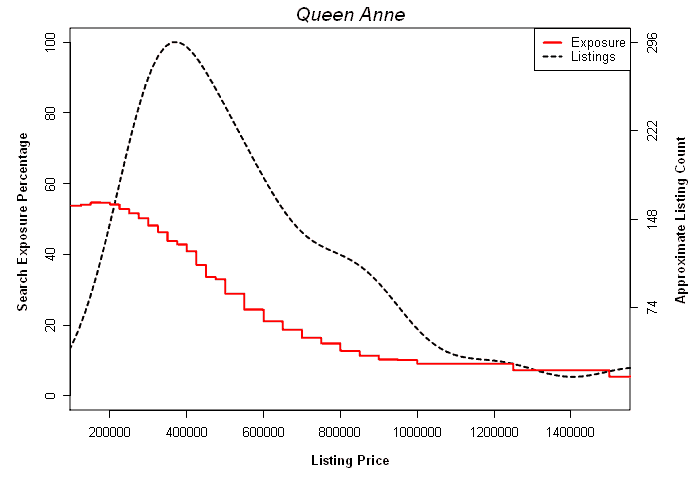
One more graph, this time for stuffy, old Queen Anne…
And here is a table of the price-points where the biggest drop in search activity occurs, and how large that drop is:
| Neighborhood | Greatest Drop in Searches Occurs at $ | % Drop in Searches |
| Ballard | $550,001 | -5.0% |
| Belltown | $550,001 | -4.3% |
| Bridle Trails | $550,001 | -5.0% |
| Capitol Hill | $550,001 | -4.5% |
| Columbia City | $425,001 | -4.4% |
| Georgetown | $425,001 | -5.1% |
| Green Lake | $500,001 | -5.5% |
| Klahanie | $2,000,001 | -5.6% |
| Laurelhurst | $550,001 | -4.9% |
| Newport Hills | $550,001 | -4.9% |
| Phinney Ridge | $550,001 | -5.3% |
| Rainier Valley | $425,001 | -4.4% |
| Ravenna | $550,001 | -5.4% |
| Windermere | $550,001 | -4.9% |
If you want to see how demand compares to inventory for your neighborhood, download a package of all our graphs for the Seattle area. If you want these graphs for another market like San Francisco or Boston, just let us know. Thanks to Mose Andre for the stats and analysis; if there are other analyses you’d like to see us perform, just leave a comment for that too.

Update: Mose cranked out some San Francisco graphs.
 United States
 Canada