On the last Tuesday of every month, just before the Case-Shiller data is released at 6 a.m., we start writing Redfin’s customer newsletter. Which has become a bit of a production. It used to be about what’s happening at Redfin — and sometimes it still is — but most of our time now is spent covering changes in the market.
The newsletter goes it out to a 108,157 people, about a third of whom open it. And then we post it here on this blog, so still more people can read it. If you want to get it hot off the presses, register for a new Redfin account, or update an existing account to ask for the newsletter.
And if you have ideas on what you’d like to see in the next newsletter — or beefs with what we said, just leave a comment below… for reference, the July newsletter is available here.
Regards, Glenn
Howdy Redfinnians!
The real estate data for July just hit the presses, and Redfin is here to combine it all into one comprehensive portrait of what’s going on in the market. The short story is that prices are up a little, sales are up a lot, interest rates are down for the moment but foreclosures are also increasing & nobody knows for sure if Congress will extend the first-time home-buyer credit. The market seems unlikely to get much better or worse any time soon. Let’s dive into the detail so you can sort it out for yourself.
Prices Increase Nationwide for the First Time in Three Years
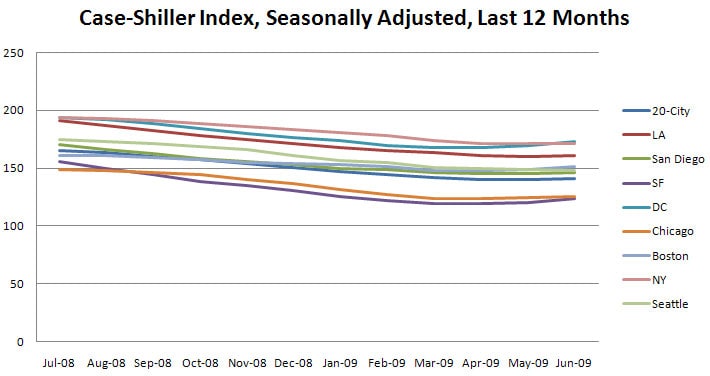
The Case-Shiller index for July 2009 came out this morning and it shows the first month-over-month price increase across the 20-city composite since May 2006 – even when adjusting for the flurry of summer demand. The 20-city composite gained .7% over June 2009, but dropped 15.5% since July 2008. Every market Redfin serves improved except for Seattle.
Prices jumped most sharply in the Bay Area (+3.1%), but the rally has been the most sustained in Chicago, Boston and Washington DC, where prices have been increasing for three or four months. Across the country, prices are now at June 2003 levels.
| City | Date of Max | Change from Max | Prices Last at This Level in… | YoY Change | MoM Change | Consec. Mos. of Increase |
| LA | Apr-06 | -41.2% | Aug-03 | -17.8% | 0.4% | 1 |
| San Diego | Mar-06 | -41.9% | Aug-02 | -16.0% | 0.7% | 1 |
| SF | Feb-06 | -43.3% | Oct-00 | -22.0% | 3.1% | 2 |
| DC | Mar-06 | -31.3% | Feb-04 | -11.8% | 2.2% | 3 |
| Chicago | Feb-07 | -25.8% | Oct-02 | -16.7% | 0.5% | 3 |
| Boston | Nov-05 | -16.4% | Mar-03 | -6.0% | 1.8% | 4 |
| New York | May-06 | -20.7% | May-04 | -12.0% | 0.1% | 2 |
| Seattle | Jul-07 | -22.2% | Apr-05 | -16.1% | -0.3% | 0 |
| 20-City Comp. | May-06 | -31.4% | Jun-03 | -15.5% | 0.7% | 1 |
Surveying the trend over the past year, we see that prices declines began moderating in March.
Led by the Northeast and the Midwest, Sales Activity Increases
Sales activity has also increased. According to the National Association of Realtors, the number of existing homes that sold increased nationwide 7.2% in July over June, the fourth consecutive month of increasing sales volume.
NAR reports this increase was almost entirely driven by sales in the Midwest and Northeast but California has also been exceptionally strong. California’s July sales increased 2.1% over June and prices increased 1.6%. In both the Bay Area and Southern California, high-end demand increased sharply, with July Southern California sales volume reaching its highest level in three years. Single-family housing starts were up 1.7% in July.
So Is This the Bottom?
All this data has led some folks to hope we’ve hit bottom. The way we think about that question is in terms of supply and demand:
- Supply is largely controlled these days by how long it takes banks to put all the foreclosed homes on the market — and they still have tons of backlog.
- Demand hinges on whether Congress extends the first-time home-buyer tax credit, set to expire on November 30, and how long interest rates can remain so low; most believe Congress will extend the tax credit.
But the Supply of Foreclosures Keeps Increasing
Let’s take a closer look at what is happening to foreclosure inventory. Foreclosure filings increased 7% in July 2009 over the same period last year, reaching record-setting levels for the third time in the last five months. The good news is that fewer home-owners are getting behind on their mortgage payments, but the bad news is that those who do fall behind are giving up more quickly than ever. Hopefully that means we’ll get through the worst of the foreclosures in the next few months unless unemployment stays high, but it will still take at least a year to sell all the foreclosed inventory off.
Interest Rates Dropping But May Increase Long-Term
That means the cost of a house is unlikely to rise substantially in the next year, but we tend to think that the cost of the money to buy it probably will: a 1% increase in mortgage rates is equivalent to a 10% increase in the cost of a home. Taking together the cost of real estate and the cost of a mortgage, Wells Fargo & the National Association of Homebuilders estimate that housing affordability is nearly the best it has been in 18 years.
So the key question is whether rates will increase much any time soon?
Mortgage rates dropped over the past three weeks to 5.52 percent for a 30-year fixed-rate loan, the lowest level since Memorial Day. Setting aside discount and origination points, the average rate has been 5.16%, very low if not quite record-setting. Most experts think rates will remain flat or fall over the next 45 days as money shifts from the stock market to interest-bearing bonds, but the long-term outlook is for higher rates because of concerns over government debt and inflation.
Redfin One of Time’s Top 50!
So that’s what’s happening in the real estate market. What about at Redfin? Well just yesterday, Time Magazine recognized Redfin as one of the top 50 sites on the Web. A few weeks ago, we made waves at the industry’s big conference in a keynote challenging the old brands to focus on service rather than sales.
And Redfin continues to employ top producers in almost every one of our markets. For example, the top-three buyers’ agents in Boston, the top-three in Seattle and two of the top ten in the DC area — are all Redfin agents. Our customer satisfaction has remained at 97% for our home-buying clients, regardless of whether the deal closes, and the company was profitable again in July. And — one more thing! — we’re hiring agents in almost every market, so please send any customer-service fanatics our way.
Alrighty, that’s it! Any questions, just write back; I almost always answer. And thank you for all your support.
Regards,
Glenn
 United States
 Canada