Case-Shiller data for June 2009 came out this morning. Once we adjust for seasonality — home prices tend to increase in the summer — we still see a nice gain in prices across every metropolitan area Redfin serves except for Seattle. For the first time since May 2006, seasonally adjusted prices increased month-over-month in the 20-city composite of the index. Year-over-year, prices are down 15.5%.
The index — we now have a formal definition of Case-Shiller in our glossay so we can stop explaining it every month — measures how the prices of houses have changed, focusing exclusively on houses that have been sold before without any major renovations, so the only real driver for a price increase or decrease is demand, rather than a new kitchen or a recently upgraded basement. The index publishes data only for an entire metropolitan area, which includes not only a city like Chicago, but also its farthest-flung suburbs.
The largest gain was in the San Francisco area at 3.1%. The most sustained gains were in DC- and Chicago-areas — where prices have increased over three consecutive months — and in the Boston area — where prices have increased for four consecutive months.
As usual, we have prepared a table summarizing the date at which each market peaked, the date when home prices were last at this level (“equivalent date”), the percentage drop from the peak, the year-over-year change, and the month-over-month change. We’ve also added a new column to track the number of consecutive months that prices have increased in a market.
| Date of Max | Equivalent Date | Change from Max | YoY Change | MoM Change | Consec. Mos. of Increase | |
| LA | Apr-06 | Aug-03 | -41.2% | -17.8% | 0.4% | 1 |
| San Diego | Mar-06 | Aug-02 | -41.9% | -16.0% | 0.7% | 1 |
| SF | Feb-06 | Oct-00 | -43.3% | -22.0% | 3.1% | 2 |
| DC | Mar-06 | Feb-04 | -31.3% | -11.8% | 2.2% | 3 |
| Chicago | Feb-07 | Oct-02 | -25.8% | -16.7% | 0.5% | 3 |
| Boston | Nov-05 | Mar-03 | -16.4% | -6.0% | 1.8% | 4 |
| New York | May-06 | May-04 | -20.7% | -12.0% | 0.1% | 2 |
| Seattle | Jul-07 | Apr-05 | -22.2% | -16.1% | -0.3% | 0 |
| 20-City Comp. | May-06 | Jun-03 | -31.4% | -15.5% | 0.7% | 1 |
In general, prices are at June 2003 levels, down year-over-year but up .7% month over month.
And here are the graphs, first for the index since 2000 so you can see the whole bubble form and then pop…

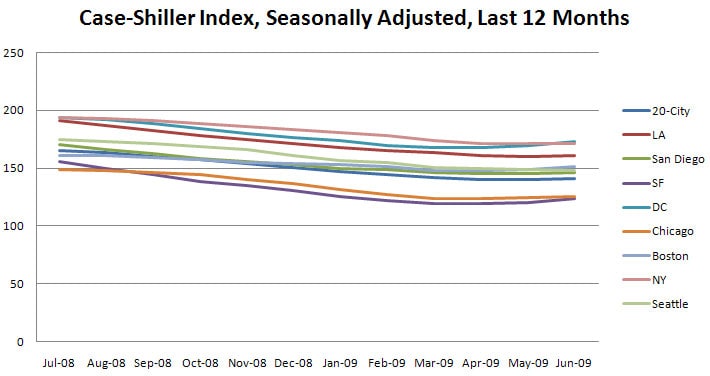
And now we see the same data for just the last 12 months, so we can see how prices are bottoming out, at least for the moment.
We still don’t know what will happen to prices once the first-time home-buyer tax credit runs out in November, or even if it will run out since the industry is lobbying Congress for an extension. What do you think will happen? As always, we anxiously await our readers’ comments…
We’ll integrate all of this data into a larger portrait of the market, hopefully later today in the big Redfin newsletter.
 United States
 Canada