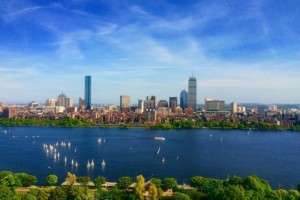
As the oldest town in America, the city of Boston is full of fascinating stories and plenty of “firsts” waiting to be discovered. So whether you just rented an apartment in Boston or you’ve owned a home in the city for years, check out this Redfin article and impress your friends and family with these must-know Boston fun facts.

1. The microwave was accidentally invented in Boston
Raytheon Engineer Percy Spencer invented the microwave in 1945; however, it wasn’t his intention to. He didn’t make the connection to food until he accidentally melted chocolate that was left in his pocket. Raytheon released the first microwave oven in 1947.
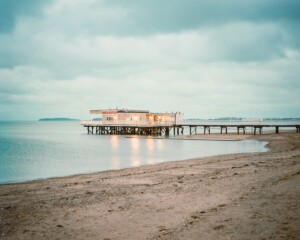
2. The first U.S. lighthouse was built here in 1716
Located on Little Brewster Island, the historic Boston Light was first lit on September 14, 1716. Although the original lighthouse was partially destroyed when the British took over the island, a new tower was constructed in 1783 and still stands today.
3. Happy Hour isn’t allowed in Boston
Throughout a majority of the U.S., “Happy Hour” often includes a range of both food and drink specials. Not in Boston, though. Massachusetts banned time-limited drink specials in 1984 after a string of drunk driving accidents. However, in recent years, there has been a strong push to “bring back Happy Hour” across the state.
4. The first subway line was created in the 1890s in Boston
Built during the second wave of the Industrial Revolution in Massachusetts, this invention helped ease the street congestion Boston was facing. This set the stage for public transportation in America.
5. You can actually drive 90 feet below the surface of Boston Harbor
The Ted Williams Tunnel is 1.6 miles long and the deepest vehicular tunnel in North America. It’s named after the Boston Red Sox legend Ted Williams.
6. The first U.S. college was founded in the Greater Boston area
Founded in 1636, Harvard University is the “oldest institution of higher education” and is one of the most prestigious universities to this day. It’s located in Cambridge, which is just under twenty minutes outside of downtown Boston.
7. Over 2 million gallons of molasses flooded the North End in 1919
This deadly accident took the lives of 21 people, several horses, and injured over 100 others.
8. The first-ever chocolate factory opened its doors in Boston
No, it wasn’t Willy Wonka who opened the factory. In 1780, James Baker founded The Baker Chocolate Company and was headquartered in Dorchester, Boston.
9. In 1990, the world’s largest art heist occurred in Boston
13 pieces of art were stolen from the Isabella Stewart Gardner Museum in just 81 minutes. The stolen collection is valued at $500 million.
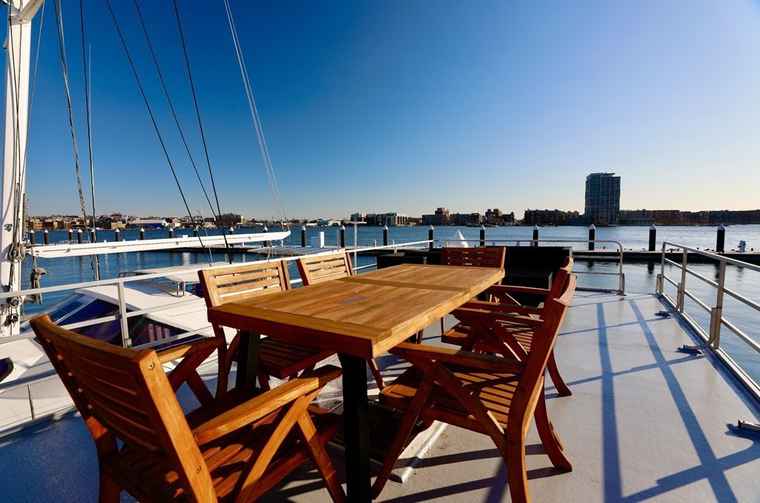
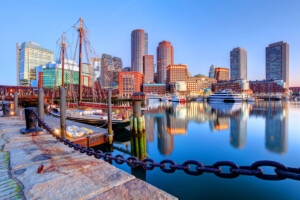
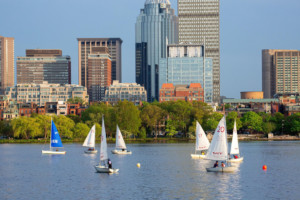
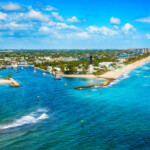
10. Boston is the only state whose capital is located along a coastline
The stunning city of Boston boasts 47 miles of ocean coastline. A mix of beaches, bays, harbors, ports, and peninsulas constitute the greater Boston Harbor. Boston is also surrounded by several small islands, such as Long Island and Governors Island.
Learn more about Boston:
Saving for a House? 5 Free Things to Do in Boston
10 Things to Do in Boston in the Winter
A Local’s Guide to Hidden Gems in Boston
The 7 Most Beautiful Places in Boston
10 Most Affordable Boston Suburbs to Live In
8 Cities Near Boston to Buy or Rent in this Year


 United States
 Canada