If you live in Chicago, IL, you’re familiar with the dynamic and multifaceted art scene. The city offers an unparalleled journey through human creativity, like world-renowned museums that house timeless masterpieces to cutting-edge galleries. But Chicago’s artistic landscape doesn’t stop at visual arts – it resonates with the music and dancing, spanning genres from blues to jazz, contemporary, and hip-hop.
Whether you’re touring apartments in Chicago, looking for homes for sale, or needing new recommendations, this Redfin article has you covered. Join us as we explore what makes Chicago a haven for art enthusiasts and cultural explorers alike. We’ll make recommendations on the top spots to visit and places to explore. Let’s get started.

Chicago museums to explore
Chicago’s museums offer a captivating journey through history, culture, and creativity, showcasing diverse art, science, and innovation. Here are a few of the top museums in the city.
The Art Institute of Chicago
The Art Institute of Chicago is a cornerstone of the city’s vibrant art scene, holding a revered status among locals and visitors. Its extensive collection spans centuries and continents, offering a rich artistic expression from ancient to contemporary times. With masterpieces by renowned artists such as Grant Wood’s “American Gothic” and Georges Seurat’s “A Sunday on La Grande Jatte,” the museum is an invaluable educational and cultural resource. Its commitment to showcasing diverse cultures and artistic genres solidifies the Art Institute’s pivotal role in shaping Chicago as a hub of creative inspiration and exploration.
Museum of Contemporary Art Chicago
This museum catalyzes conversations around contemporary issues and artistic evolution by showcasing works from established and emerging artists across various mediums. Its role in fostering artistic experimentation and encouraging dialogue makes the Museum of Contemporary Art Chicago a vital and transformative force within the Chicago art scene.

Lively Chicago art festivals to check out
Known for hosting exceptional art festivals, Chicago showcases diverse artistic expressions and fosters a vibrant atmosphere of cultural celebration. Here are a few of the top art festivals in the city.
Millennium Art Festival
“The Millennium Art Festival provides a wonderful opportunity for people to interact with the artists and see spectacular, unique, hand-made pieces from artists all over the country,” shares Amy Amdur, CEO of Amdur Productions. “When attending these fests, we suggest planning ahead by visiting our website to get acquainted with the various artists and their work and the surrounding neighborhood. We encourage attendees to make a full day of it by enjoying a variety of activities at the fest, as well as exploring the unique shops and restaurants that are just steps away.”
Printer’s Row Art Fest
Nestled in the historic Printer’s Row neighborhood, the Printer’s Row Art Festival transforms the streets into a dynamic gallery where skilled artisans proudly display their handcrafted treasures. From intricate hand-bound books to mesmerizing woodblock prints, visitors can immerse themselves in the tactile beauty of the creative process.

Must-see Chicago galleries
From contemporary innovation to classical mastery, Chicago galleries showcase an array of artworks that mirror the city’s dynamic spirit and cultural diversity. Here are a few of the best.
Bridgeport Art Center
“There are two expansive art galleries situated on the third and fourth floors of the Bridgeport Art Center,” reveals Karen I. Hirsch, a local photographer. “Moreover, individual artists within the building graciously unveil their studios to the public. Adding to the building’s allure is the Chicago Maritime Museum, nestled on the lower level.”
Blue Moon Gallery
Lynne, a publisher of the Fox Valley Art BEAT, an art news site, suggests visiting the Blue Moon Gallery. “The owner of Blue Moon Gallery, Kendra Kett, curates beautifully, choosing local artists who know what sells well and prices it right. Although the gallery looks deceptively small from the street, once inside, it is open, airy, and bright with soothing colors, a salon approach to display, tabletop art, high ceilings, and even clerestory windows filling the length with natural light.”
Local Chicago artists to Look into
Chicago boasts a wealth of exceptionally talented local artists, whose creativity and innovation contribute to the city’s thriving artistic landscape. Check out a local favorite below.
Plein Air Painters Chicago
“Did you know you can see art depicting Chicago being made by professional artists every Saturday morning from April through October,” says Mary Longe, a local artist. “Each weekend, 10-30 members of the renowned Plein Air Painters Chicago paint a neighborhood. You can watch, bring your own easel, or purchase art as it’s being completed by some of Chicago’s most talented artists. Iconic and compelling scenes are painted in oils, watercolors, pastels, gouache, casein, and acrylics.”

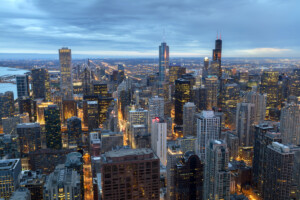
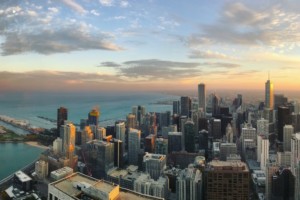
Chicago architecture that can’t be missed
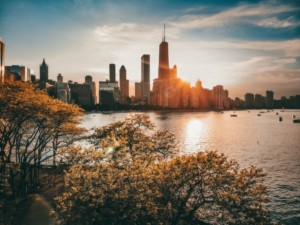
Chicago’s architecture is integral to the city’s art scene, blending aesthetics and functionality to create a dynamic urban canvas. A great way to see the iconic Chicago landscape is through tours like the Chicago River Boat Architecture Tours. There you’ll be surrounded by historic and modern day buildings. Here are a few spots to keep in mind.
Chicago Riverwalk
“Immerse yourself in Chicago’s artistic scene by strolling down the Chicago Riverwalk,” suggests Christiane Sola, the Chicago School of Musical Arts co-founder. Enjoy the breathtaking architecture and local musicians performing along the route, creating an unforgettable urban gallery. An array of restaurants and bars and stunning waterfront views invite locals and tourists to savor Chicago’s boundless expression of art and vibrancy.”
Willis Tower
The Willis Tower is a monumental piece of architecture that significantly enriches the Chicago art scene. Once the world’s tallest building, its soaring silhouette seamlessly merges form and function, becoming an iconic representation of the city’s artistic spirit. The tower’s distinctive design, with its bundled-tube structure and imposing presence, has inspired countless artists to capture its essence through various mediums, from paintings to photographs.

Diverse Chicago dance communities to discover
The dance scene in Chicago resonates with performances, fusing jazz, ballet, and diverse movements that showcase the city’s artistic energy. Here are a few great spots to enjoy.
The South Side Jazz Coalition
The South Side Jazz Coalition hosts jazz jams, pop-up concerts, and the popular Jazz’n On The Steps in the beautiful Woodlawn neighborhood. Festivals will be happening in Bronzeville and Englewood through October, as live music is “the happening” on the south side of town.
Scottish Country Dancing
Feel like venturing further afield? Head to Naperville. Participate in a lively class with Chicago Scottish Country Dance, a group that meets every Tuesday evening to learn and enjoy this social set dancing from Scotland.
Other ways to dive into Chicago’s art scene
Chicago is teeming with many shops showcasing vintage items, art, and records that further add to the diverse art scene. One way to learn about the city is taking a trip through the shops.
Explore some of Chicago’s popular shops
Mady from Renegade Craft, the leading showcase of independent craft and design, encourages you to “Kick the day off by sifting through records at Reckless Records, then head to Renegade vendor Demolition Collective’s storefront for a different kind of vintage sifting. Get your aura photographed by the loveliest Aura/Iris, then check out Gucha Gucha’s creative studio and shop. End the day with a visit to Co-Prosperity, an “experimental cultural center” that will inspire you to apply to Renegade yourself.”


 United States
 Canada