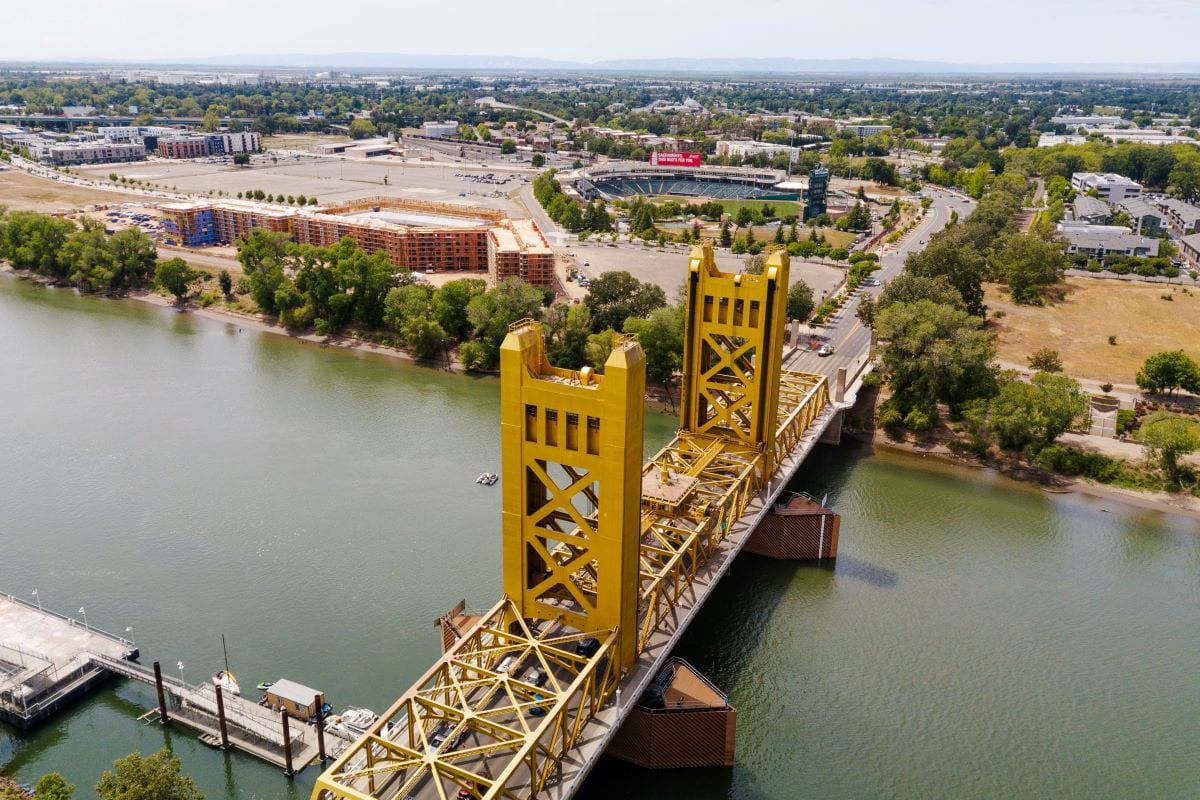
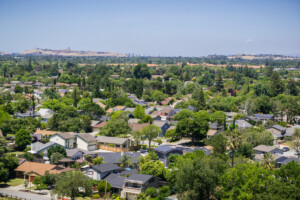
As California’s capitol, Sacramento has a rich history, vibrant present, and lively neighborhoods to match the city’s vibe. With views of the American River, historic buildings throughout downtown, and green parks dotted in each enclave, Sacramento’s neighborhoods have something to offer anyone buying a home or renting an apartment in Sacramento.
From Boulevard Park, to East Sacramento, and Pocket, there are a long list of one-of-a-kind neighborhoods to explore. For example, the average rent in Sacramento is $1,985, while the median sale price is $500,000.
But if you’re moving to Sacramento, then you may be wondering where in the city you want to call home. At Redfin, we’ve put together a guide to 16 popular Sacramento neighborhoods. That way you can explore the neighborhoods that make Sacramento what it is today – and find the one that matches your lifestyle.

1. Boulevard Park
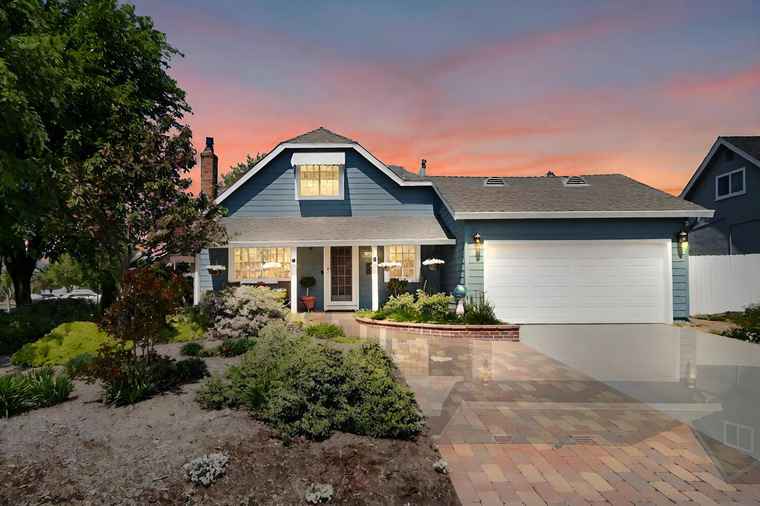
Boulevard Park is located in the heart of Sacramento. A historic neighborhood, you’ll find beautiful tree-lined streets, historic homes, and a charming neighborhood feel. The neighborhood is home to plenty quaint coffee shops, local businesses, art galleries, and community gardens. Boulevard Park is also listed on the National Register of Historic Places as the Boulevard Park Historic District meaning you’ll find many preserved homes and historic buildings. Additionally, Boulevard Park features a variety of housing types and architectural styles, including Craftsman, Tudor, and Victorian homes.
Median Sale Price: $563,000
Average Rent 1-Bedroom Apartment: $1,495 | Average Rent 2-Bedroom Apartment: $1,850
Homes for Sale in Boulevard Park | Apartments for Rent in Boulevard Park
2. Curtis Park
South of Midtown is Curtis Park, known for its historic Craftsman bungalow and Tudor Revival homes set against green streets. The neighborhood is home to several parks, including Curtis Park itself, which features a playground, tennis courts, and picnic areas. Additionally, Curtis Park is known for its historic places found throughout the neighborhood like the Anne Hathaway Cottage and J.C. Carly House.
The housing options in Curtis Park primarily consist of single-family homes and bungalows, which reflect the neighborhood’s historic architectural styles. Many of these homes have been well-preserved and showcase stunning details and craftsmanship.
Median Sale Price: $790,000
Average Rent 1-Bedroom Apartment: $1,595
Homes for Sale in Curtis Park | Apartments for Rent in Curtis Park
3. Del Paso Heights
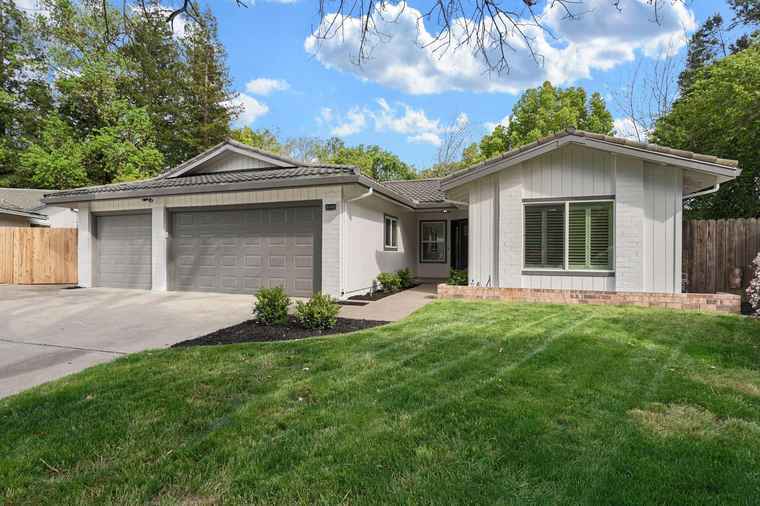
Del Paso Heights is located in North Sacramento and is known for its close proximity to downtown and major freeways. The neighborhood is home to several parks, including Mama Marks Park, which offers playgrounds, picnic areas, and sports fields. In Del Paso Heights, you will find a mix of housing types, including single-family homes, townhouses, and apartments. The architectural styles in the neighborhood vary, ranging from mid-century modern to contemporary designs.
Median Sale Price: $362,500
Homes for Sale in Del Paso Heights | Apartments for Rent in Del Paso Heights
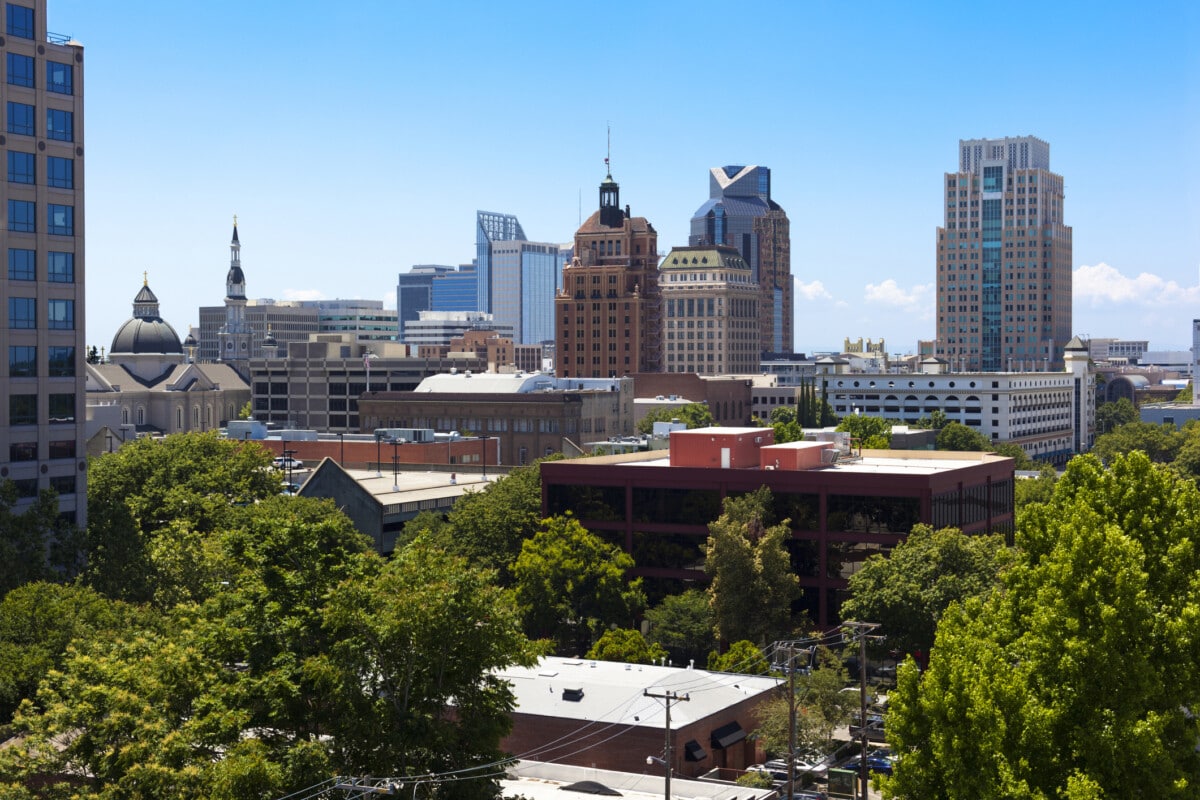
4. Downtown
Downtown offers a vibrant and energetic atmosphere filled with plenty of attractions and things to do. A few of Downtown’s major sites include the California State Capitol Park, which houses the State Capitol building, the Crocker Art Museum, and the Golden 1 Center, home to the Sacramento Kings. For outdoor enthusiasts, there are several parks nearby, including Capitol Park and Cesar Chavez Plaza. There are plenty of historic buildings, homes, and museums in the neighborhood to explore. Downtown features a mix of housing types, including high-rise condominiums, loft-style apartments, and townhouses.
Median Sale Price: $668,000
Average Rent 1-Bedroom Apartment: $2,467 | Average Rent 2-Bedroom Apartment: $3,082
Homes for Sale in Downtown | Apartments for Rent in Downtown

5. East Sacramento
East Sacramento is just east of downtown, making it easy to enjoy all that the city has to offer. The neighborhood is home to the McKinley Park, which offers a range of recreational activities such as jogging trails, tennis courts, and a rose garden. Other major attractions in the area include the Fabulous Forties, a collection of beautiful homes featuring various architectural styles. East Sacramento offers a mix of housing types, including historic homes, Craftsman-style houses, and modern townhouses.
Median Sale Price: $888,500
Average Rent 1-Bedroom Apartment: $1,795 | Average Rent 2-Bedroom Apartment: $2,895
Homes for Sale in East Sacramento | Apartments for Rent in East Sacramento
6. Land Park
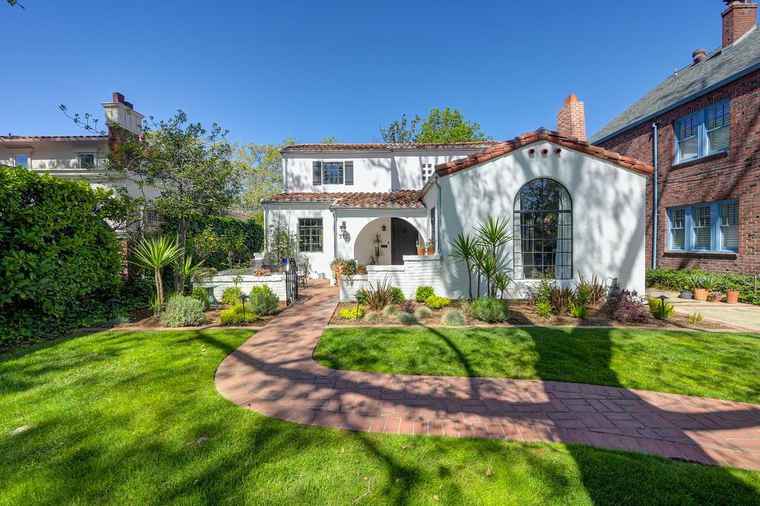
West of Curtis Park is the Land Park neighborhood, home of the famous William Land Park, which offers acres of green space, lakes, and playgrounds. Land Park is also home to the Sacramento Zoo and the historic Land Park Golf Course. The housing types in Land Park vary from classic bungalows to larger Mediterranean-style homes. The architectural styles range from Craftsman to Spanish Revival, giving the neighborhood its unique character.
Median Sale Price: $823,000
Average Rent 1-Bedroom Apartment: $1,895
Homes for Sale in Land Park | Apartments for Rent in Land Park
7. Meadowview
Meadowview is located in the southern part of Sacramento, recognized for its tranquil and scenic surroundings. It’s home to several parks and green spaces, offering residents ample opportunities for outdoor activities. Meadowview offers a variety of housing types, including single-family homes, townhouses, and apartments. The architectural styles in this neighborhood range from traditional to modern, ensuring there is something to suit everyone’s taste.
Median Sale Price: $408,000
Homes for Sale in Meadowview | Apartments for Rent in Meadowview
8. Midtown
Midtown is east of downtown and has its vibrant art scene, diverse culinary options, and lively nightlife. The neighborhood is also home to several major attractions such as Sutter’s Fort State Historic Park, Harlow’s, and the Saturday Midtown Farmers Market. Residents can enjoy spending time outdoors at McKinley Park, which offers walking trails, playgrounds, and a rose garden. Midtown is also rich in history and is dotted with charming Victorian-era homes and buildings.
Median Sale Price: $800,000
Average Rent 1-Bedroom Apartment: $1,675 | Average Rent 2-Bedroom Apartment: $2,375
Homes for Sale in Midtown | Apartments for Rent in Midtown

9. Newton Booth
South of Midtown is the Newton Booth neighborhood known for its historic charm. This neighborhood is more of a residential area, but its central location makes it easy to explore the heart of Sacramento. Newton Booth offers a variety of housing types, including Victorian-style homes and Craftsman-style bungalows. The architectural styles in the neighborhood reflect its rich history and contribute to its unique character.
Median Sale Price: $582,500
Average Rent 1-Bedroom Apartment: $1,695 | Average Rent 2-Bedroom Apartment: $1,875
Homes for Sale in Newton Booth | Apartments for Rent in Newton Booth
10. North Oak Park
North Oak Park is conveniently located near downtown Sacramento. The neighborhood has several parks, including nearby McClatchy Park, which features a playground, picnic areas, and sports courts. One of the historic places in North Oak Park is the Guild Theater, a popular venue for live performances and special events. The housing types in North Oak Park vary, with a mix of single-family homes, apartments, and duplexes, in styles ranging from historic Victorians to charming Craftsman bungalows.
Median Sale Price: $571,000
Average Rent 1-Bedroom Apartment: $1,400 | Average Rent 2-Bedroom Apartment: $1,995
Homes for Sale in North Oak Park | Apartments for Rent in North Oak Park
11. Old North Sacramento
Old North Sacramento has a historical charm that fits in alongside shopping centers, parks, and businesses. There is plenty to do in the area such as biking along the Sacramento Northern Bike Trail. Old North Sacramento offers a mix of housing types, including charming bungalows and Victorian-style homes.
Median Sale Price: $377,000
Average Rent 1-Bedroom Apartment: $1,345
Homes for Sale in Old North Sacramento | Apartments for Rent in Old North Sacramento
12. Pocket
Pocket is known for its convenient location along the Sacramento River and is just a 5-mile drive into downtown Sacramento. There are several parks in the area, such as Garcia Bend Park and Portuguese Community Park, providing residents with plenty of outdoor recreational opportunities. Pocket offers a variety of housing types, including single-family homes and townhouses in styles ranging from mid-century modern to contemporary designs.
Median Sale Price: $606,500
Average Rent 1-Bedroom Apartment: $2,363
Homes for Sale in Pocket | Apartments for Rent in Pocket


13. Richards
Richards is north of downtown and known for it’s convenient location along the shores of both the American River and the Sacramento River. There are plenty of parks in the area as well as trails like the Two Rivers Bike Trail. It’s also close to downtown and museums like California State Railroad Museum and SMUD Museum of Science and Curiosity. Richards offers a mix of housing types, including single-family homes and mid-rise apartments. Architectural styles in the neighborhood range from historic Victorian homes to modern apartment buildings.
Median Sale Price: $697,000
Homes for Sale in Richards | Apartments for Rent in Richards
14. River Park
River Park is known for its scenic location along the American River. Its main attraction is Paradise Beach where you can swim, picnic, and fish along the American River. The housing options in River Park include single-family homes and apartments in styles like mid-century modern to contemporary.
Median Sale Price: $794,500
Average Rent 1-Bedroom Apartment: $1,575
Homes for Sale in River Park | Apartments for Rent in River Park
15. South Natomas
South Natomas offers a suburban feel, just across the river from downtown. Major attractions in South Natomas include Discovery Park set along the Sacramento River. Residents can also enjoy several parks, such as Bannon Creek Park and Northgate Park. South Natomas offers a variety of housing types, including single-family homes, townhouses, and apartments.
Median Sale Price: $490,000
Average Rent 1-Bedroom Apartment: $1,640 | Average Rent 2-Bedroom Apartment: $1,940
Homes for Sale in South Natomas | Apartments for Rent in South Natomas
16. Upper Land Park
Adjacent to Land Park is the Upper Land Park neighborhood. It’s home to Miller Regional Park which has views of the river, trails, and plenty of picnic spots. You can also find the Sacramento Marina located in this park, making it easy to take a boat out onto the Sacramento River. Upper Land Park predominantly features single-family homes with architectural styles ranging from Craftsman to Spanish Revival.
Median Sale Price: $605,000
Homes for Sale in Upper Land Park | Apartments for Rent in Upper Land Park
Methodology: All neighborhoods must be listed as a “neighborhood” on Redfin.com. Median home sale price data from the Redfin Data Center during September 2023. Average rental data from Rent.com during September 2023.


 United States
 Canada